Personal Projects
I have some Personal projects to put for display.
... have a look at them with a pinch of salt.
Click to view the dashboards and prediction models on my GitHub...

Nepal Earthquake
Built logistic regression and decision tree models to predict earthquake damage to buildings, extracted data from a #sqlite database, and revealed the biases in the data that can lead to discrimination. Details

PREMIER LEAGUE TEAM DASHBOARD
Built a dashboard to showcase the team wise performance over the years of all the Premier league teams highlighting their stats like Goals, Corners, fouls, matches played etc Details

PFIZER TWITTER SENTIMENT ANALYSIS
Understanding the sentiment around the Pfizer vaccine will be helpful in understanding how the public feels, and indicate how receptive they are to taking the vaccine.
With the SentimentIntensityAnalyzer imported from VADER, we can not only gather count of sentiment for the tweets, but classify them and create a new column that labels the tweet Positive, Negative, or Neutral. This labeling can be used to show difference between sentiment. I will also show how sentiment has looked over time.Details

SPOTIFY TRACK POPULARITY
Understanding the popularity of tracks on Spotify which will be helpful in understanding how the public feels, and indicate what actually is the mass listening.
With the XGBoost and other Regression models gather sentiment for the songs, artists and albums.Details
/cdn.vox-cdn.com/uploads/chorus_asset/file/23337555/GettyImages_1210378202.jpg)
CAR PRICE PREDICTION MODEL
Understanding the factors affecting the price of a Car which will be helpful in understanding how the Auto industry market functions, and indicate what Selling Price of a car would be from the data available.
With the Random Forest Regressor and other Regression models gather insights for the auto industry from the Kaggle's CarDekho.com dataset.Details

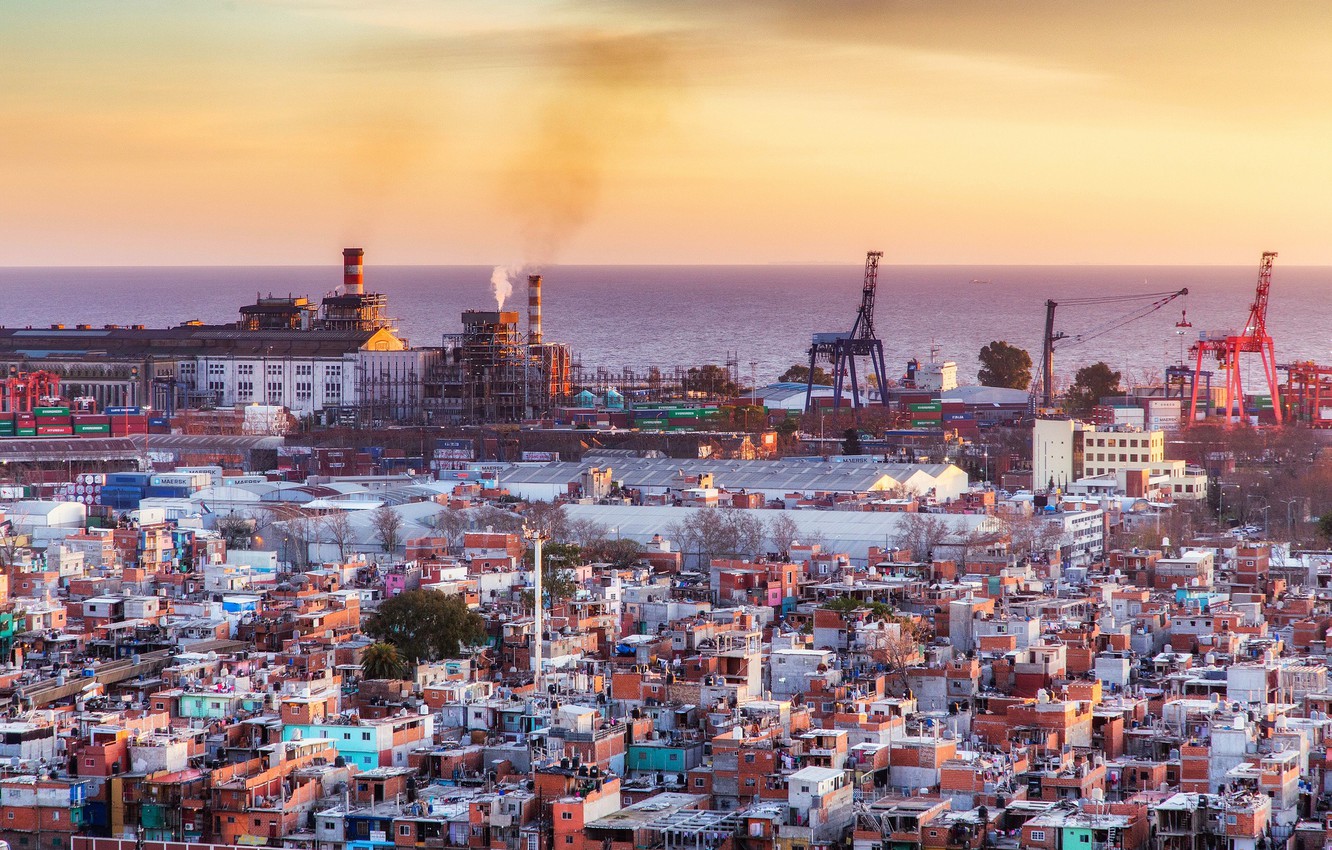
Predicting Housing Prices
A dataset of 21,000 properties was used to determine if real estate prices are influenced more by property size or location. Imported and cleaned data from a CSV file, built data visualizations, and examined the relationship between two variables using correlation.Built a linear regression model to predict apartment prices in Argentina. Created a data pipeline to impute missing values and encode categorical features, and then improved the model performance by reducing overfitting.Details
Time Series Modelling
Built an #arma time-series model to predict particulate matter levels in Kenya, extracted data from a Mongodb database using PyMongo, and improved model performance through hyperparameter tuning.Details
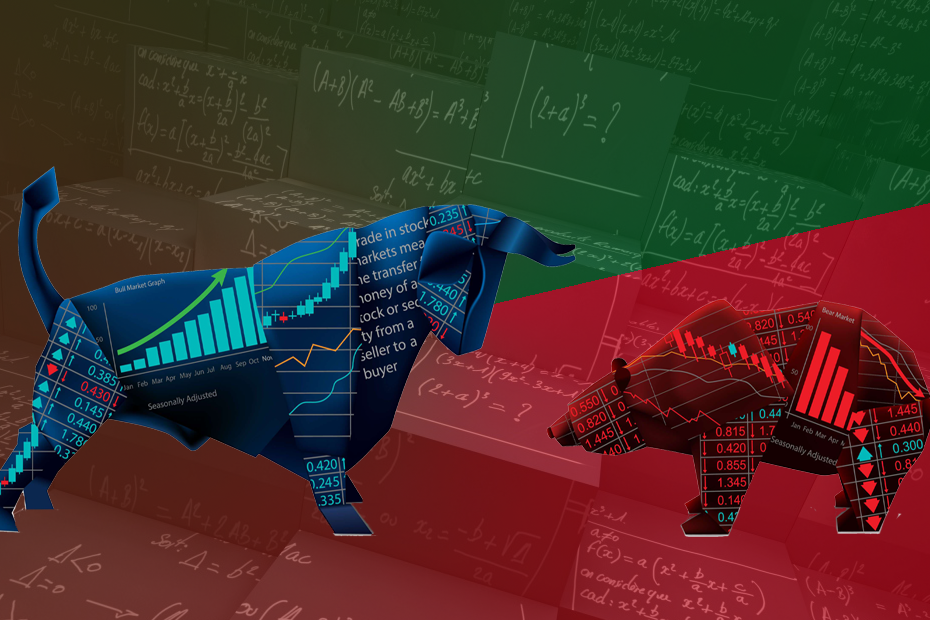
Stock Market Prediction
Created a GARCH time series model to predict asset volatility, acquired stock data through an API, cleaned and stored it in a SQLite database, and then built an API to serve model predictionsDetails

CUSTOMER SEGMENTATION IN THE US
Built a k-means model to cluster US consumers into groups, used principal component analysis (PCA) for data visualization, and then created an interactive dashboard with Plotly Dash Details

MOVIE RECOMMENDATION SYSTEM
Built a tool that suggests movies to users based on their past preferences and ratings. This project used machine learning libraries in Python, including Bag of Words and Streamlit, to build a recommendation system. The TMDB dataset was used to train and test the model. The system first preprocessed the data, extracting relevant features and cleaning the dataset. Then, it used the Bag of Words method to convert the movie plot summaries into numerical feature vectors, which were used to train the recommendation model. The model was then deployed using the Streamlit library, allowing users to easily interact with the system and receive personalized movie recommendations. Details